
The candlestick pattern is one of the most popular and used chart patterns in forex, crypto, and other Securities and financial markets. There are some other graphs in the chart. For example line charts, graph charts, Heikin-Ashi candles, and so on. But the candlestick chart pattern is used all over the world. Because it’s easy to understand and easy to analyze the market. The candlestick pattern is also known as the Japanese candlestick pattern. Because it was invented in Japan. In this article, we will discuss some exclusive Candlestick patterns cheat sheet. It’s the ultimate guideline hack of candlestick patterns that nobody tells you. It is totally a new, different, and accurate way to use it. But first, you have to know what a candlestick pattern is.
What are Candlestick Patterns?
In financial technical analysis, a candlestick pattern is a price movement plotted on a candlestick chart that some believe can predict a specific market movement. Pattern recognition is subjective, and the programs used for mapping must rely on predefined rules to match the pattern.
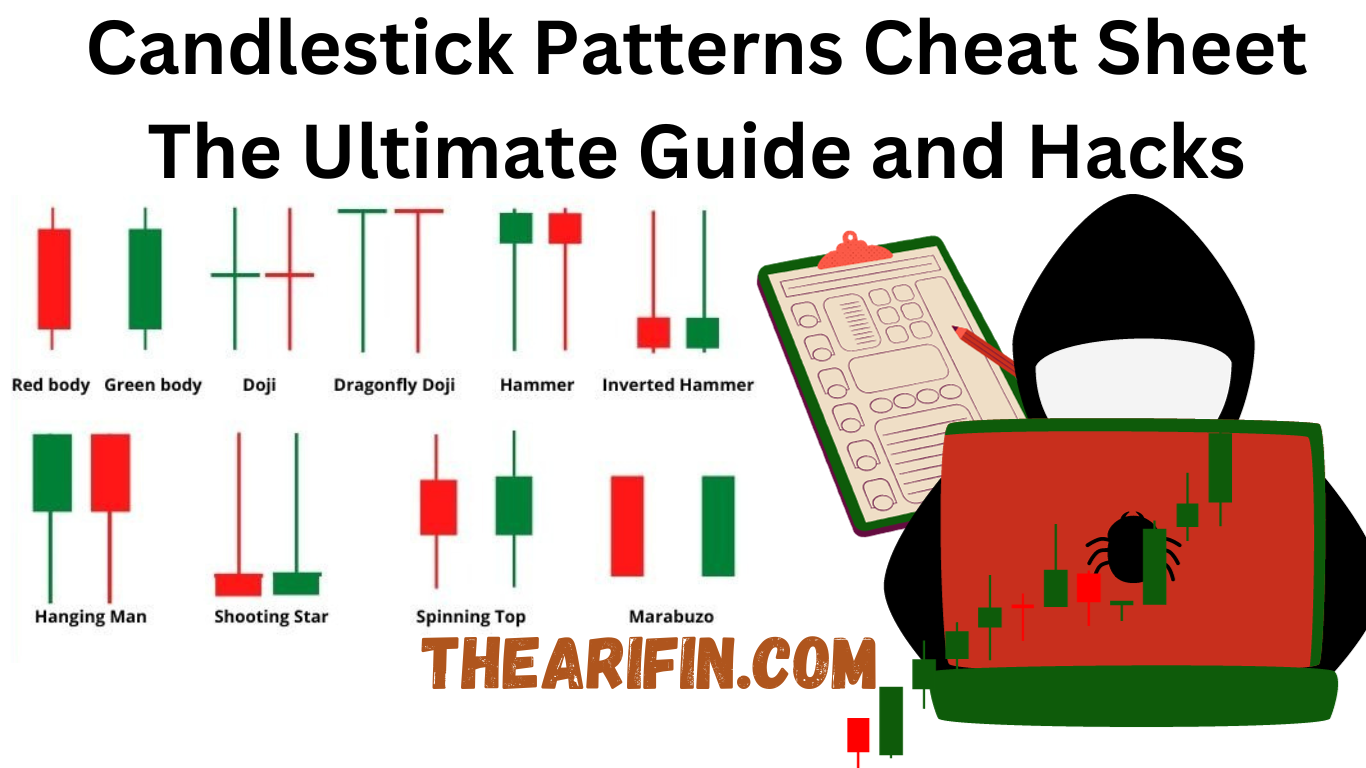
Candlestick Patterns Cheat Sheet
Single Candlestick Pattern
Hammer Candlestick Pattern
 The hammer candlestick pattern is a very easy and used candlestick pattern in Trading. Because it’s easy to spot in the chart and the hammer candlestick pattern is seen in the chart so many times in a day.
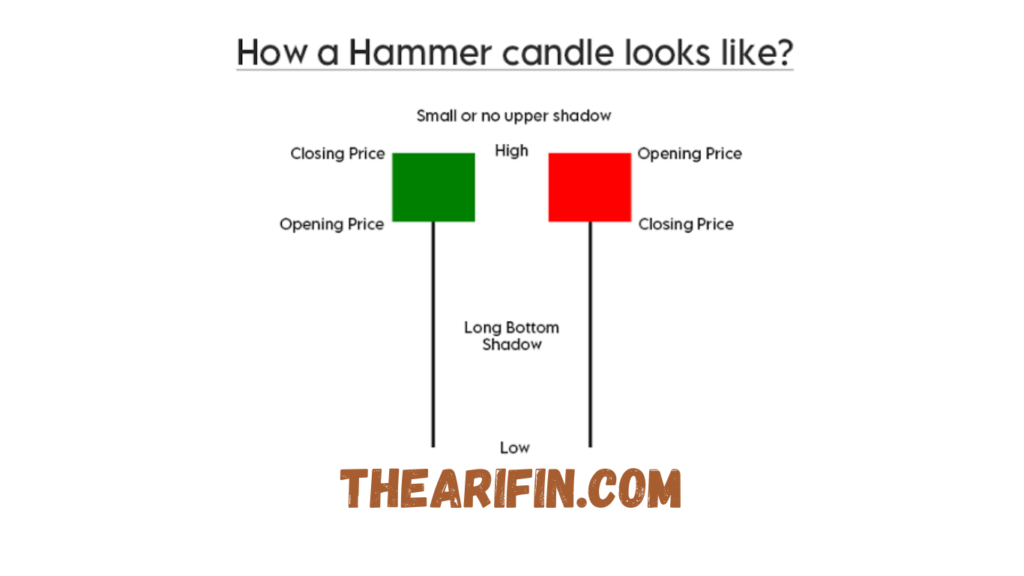
Identify Hammer Candlestick Pattern
 A hammer candlestick pattern is a bullish candlestick pattern that forms during a long downtrend. It is a sign of reversal. It tells that the downtrend is almost come to an end. Now a new uptrend may start.
When you will see a hammer candlestick pattern form in the chart. Then you should take a reversal trade from the support zone. So you must know what is support and resistance and how to draw them properly.
A hammer is identified by its long tail on the downside. The tail must be at least 3 times bigger than its body. The story of a hammer tells that the seller tries to push on the downside and do all their effort but in the end, the buyers are in control. They take the market up. That’s why it’s a sign of the end of a downtrend.
Misconceptions
A hammer forms in the support zone. So it can be a green candle or it also can be a red candle. But its meaning are same. A hammer in the support zone may change the trend of the market in a ranging market. But a hammer behaves differently in different markets. To understand this you have to know about market structure. In a trending market, a hammer tells us that the market is in a trendy mood and will continue its trend.
Hanging Man Candlestick Pattern
 A hanging man candlestick pattern is also the same as the hammer. The difference between a hammer and a hanging candlestick pattern is it’s formed in the resistance zone in the chart.
Identify the Hanging Man Candlestick Pattern

A hanging man candlestick pattern is a strong bearish reversal pattern. After a long bullish trend a hanging man candlestick pattern forms. It shows and tells us that the bullish trend is now ready to end.
The market may reverse from that point. Hanging man candlestick pattern forms in the resistance zone. So you must know how to draw a resistance zone. Identify the hanging man in the resistance zone trade and then open a short trade.
A hanging man also looks the same as a hammer. Its criteria are also the same as hammer candles.
Misconceptions
The color of a hanging man candle can be red or green. But its meaning is the same. the market will start to move in the bearish trend in a ranging market when a hanging man candle forms. If the hanging man candle forms in a downtrend market. Then it tells that the market will continue its downtrend. In that case, the candle must form in the trendy downward market somewhere there is no resistance zone.
The Shooting Star Candlestick Pattern
 The Shooting Star candlestick pattern is also a reversal candle. It looks like a hammer and hanging man. But the main difference between a shooting star and a hammer, hanging man is the shooting star candlestick pattern is a reverse hammer shape.
Identify Shooting Star Candlestick Pattern

A shooting star candlestick pattern forms in the resistance zone in the ranging market. It tells us that the uptrend is going to an end. It is a sign of a reversal trend. The shooting star candle criteria are the same as hanging man and hammer candle.
In the resistance zone Shooting Star Candle tells us that the buyers tried hard and soul to push the market up. But in the end, the seller overpowered them and turned the market into a reversal zone.
Misconceptions
Shooting star candle colors also can be green or red. The meaning is the same. It works reversal on a ranging market and works as a trend continuation in the trendy market.
Inverted Hammer Candlestick Pattern
 The inverted hammer candlestick pattern is also known as the reverse hammer candlestick pattern. As I mention all of these candlestick patterns are in same. The difference between them is where they formed and what role they played.
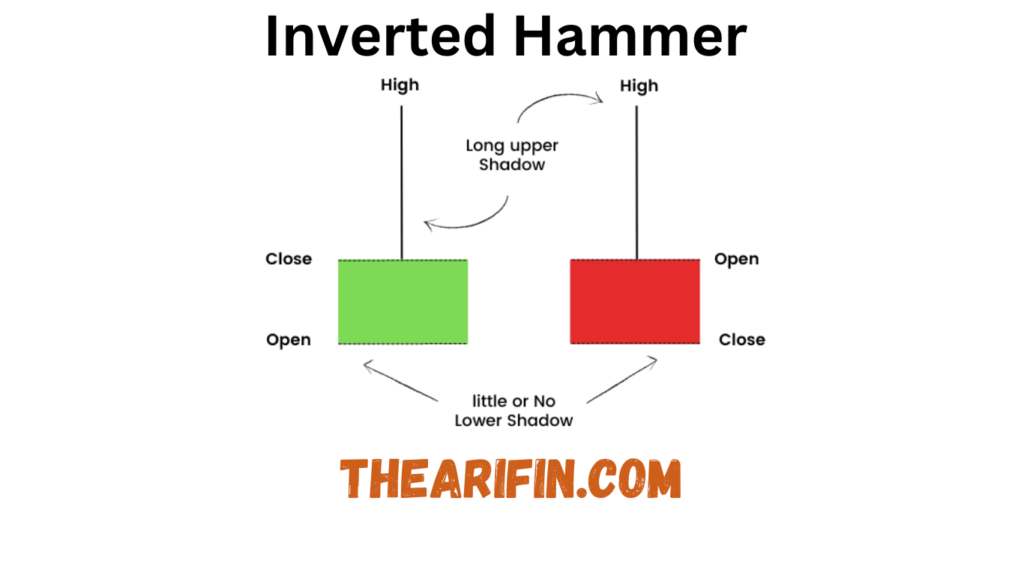
Identify Inverted Hammer Candlestick Pattern
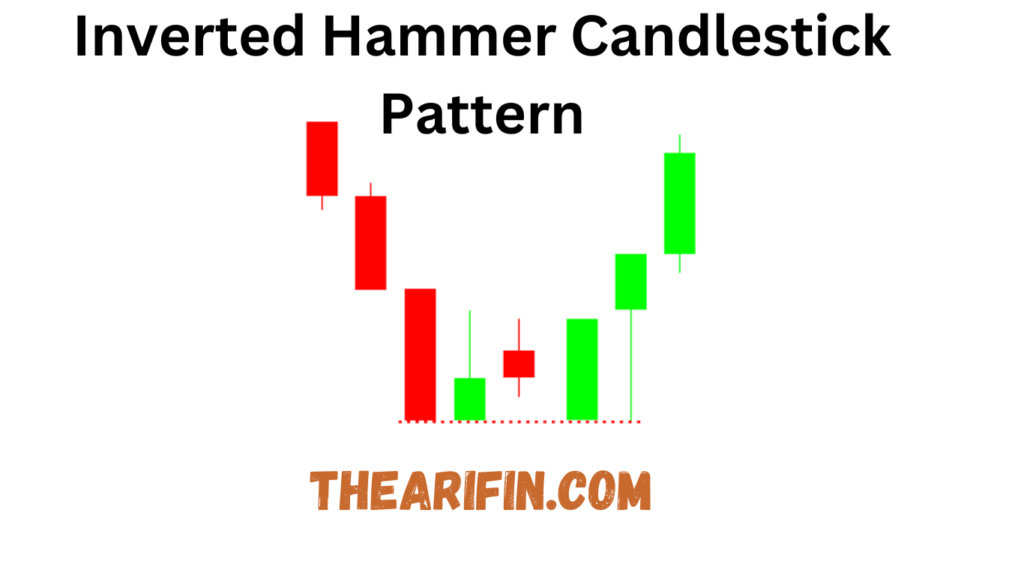 It’s a bullish trend reversal candlestick pattern. It forms the support zone in a ranging market. An inverted hammer or reversal hammer candle tells us that the seller tried their best to keep the market down. But a steady rise of buyers and buyers pushes the market up. That means the power of the seller are end. Now it is time for buyers to make an uptrend. That’s why an inverted hammer always gives a sign of trend reversal.
Misconceptions
Same case with an inverted hammer. Green or red doesn’t matter. Trade reversal at support zone and trade continuation in the trendy market.
Doji Candlestick Pattern
 Doji candles are also called neutral candles. The logic behind this candle is the power of buyers and sellers is equal. That’s why it is an indecisive candle. You can not predict Whether the market will go uptrend or downtrend after a doji candle. Most of traders trade doji candle as a reversal candle. But the truth is that the Doji candle is a very risky candle to trade. Because you don’t who will overpowered by whom. The buyers or the sellers. A doji candle is easily spotted in the chart. You can see in the image that some cases a doji candle has a very thin body of green or red color. It depends on the broker that you are using. In some broker’s charts, a Doji candle is marked as a gray color.
There are three kinds of doji candle
Dragonfly Doji candle
Long-legged Doji candle
Gravestone Doji candle
Though all Doji candles look different from each other. But they all are indecisive candles.
Conclusion and Hacks
This is the ultimate candlestick patterns cheat sheet that a lot of traders don’t know. Most of the traders know how to trade on hammers. But they don’t know that a hammer candle reacts differently in a ranging markets and trendy markets.
Only the candlestick patterns cheat sheet is not enough to trade on the financial market. You have combined candlestick patterns with other key factors like indicators, chart patterns, and so on. If you have any difficulties understanding or memorizing these four patterns. Here is a little hack for you. If you see any of these four candles in support or resistance zones. Mark that as a sign of reversal. Then you can trade on reversals. And when those candles form in a trendy market. That means the trend will continue.
The broker plays a very important role in trading. There are so many brokers who manipulate their charts. For example, if a hammer forms in Tradingview chart. On the contrary, the broker’s chart doesn’t form a hammer candle. Thus some brokers manipulate the charts. For this reason, the trader becomes confused and trades with the wrong decision and book losses. But there are a lot of trusted and top-notch brokers like Exness, FBS, and M4Markets that don’t manipulate the market and have a very low or no spread at all. So always trade with professional brokers who have given services to their customers for decades.